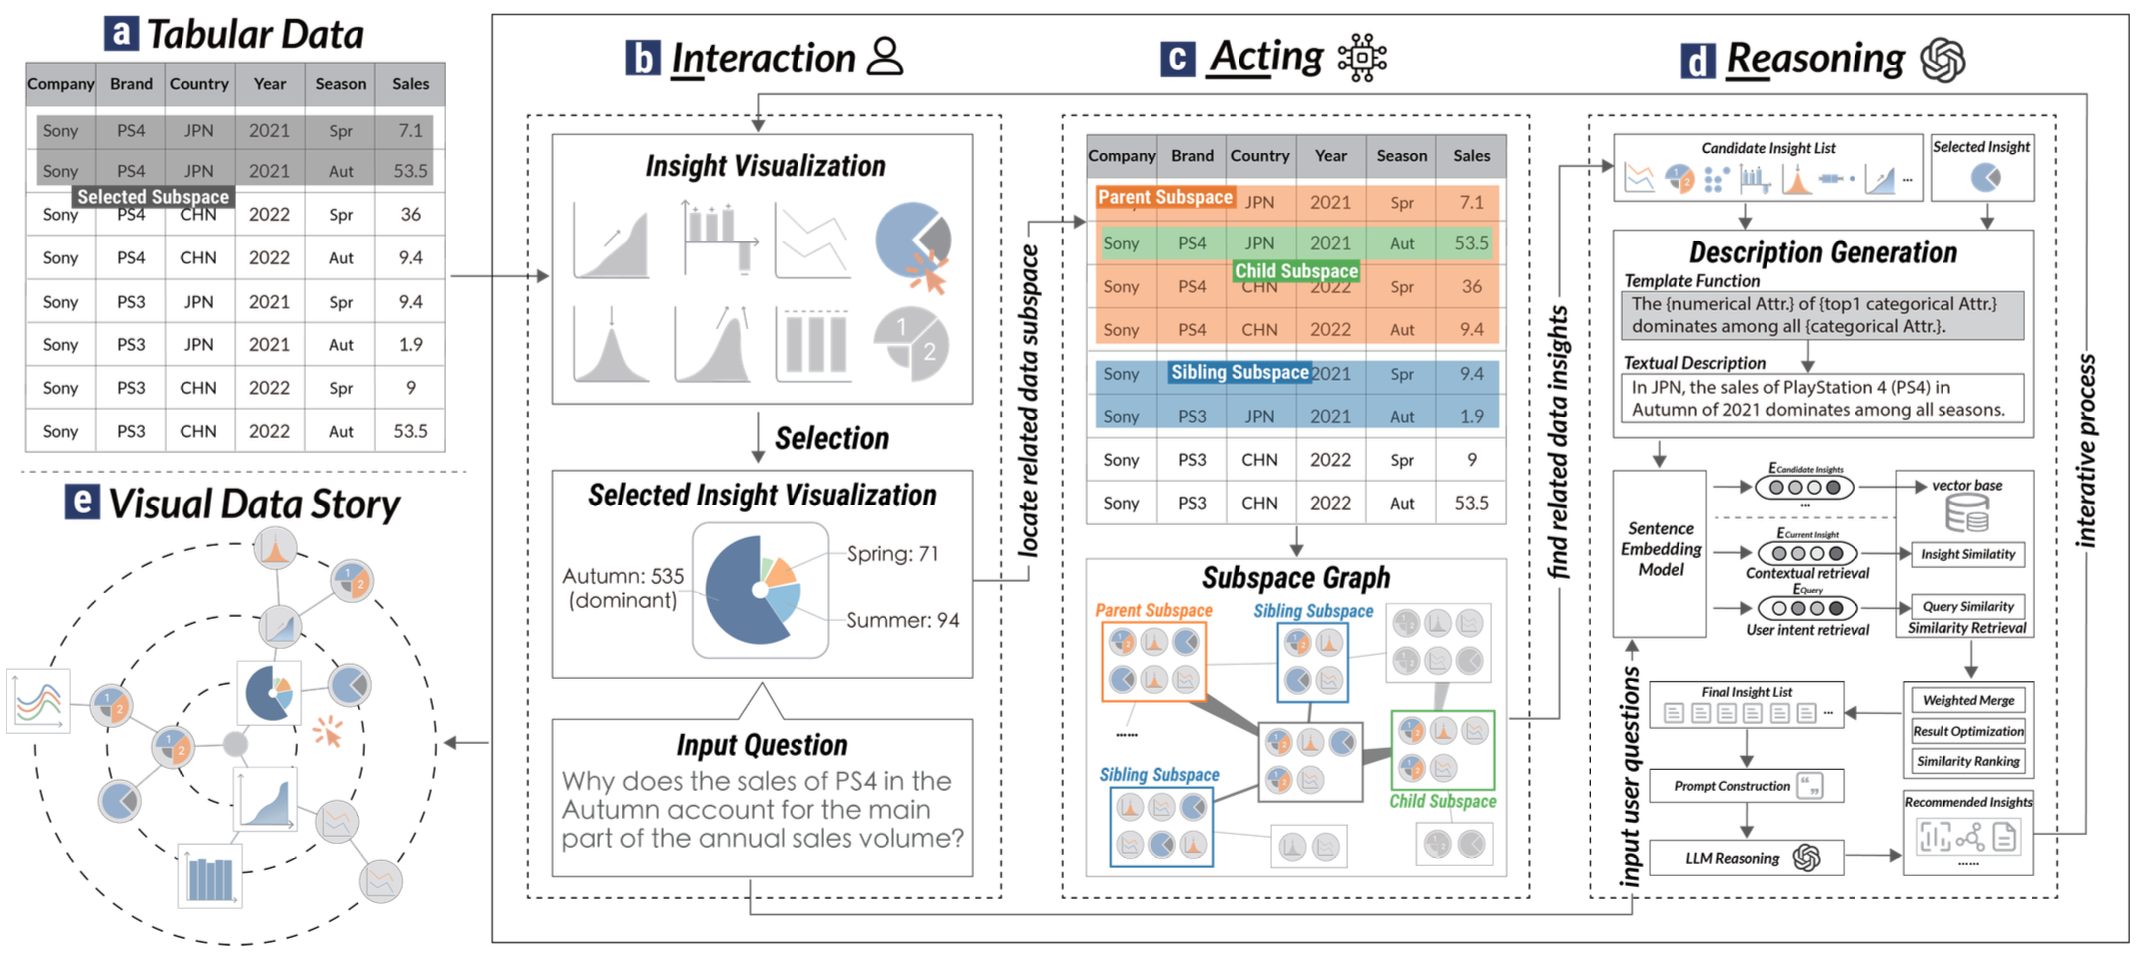
@inproceedings{aodeng2025inreactable,title={InReAcTable: LLM-powered Interactive Visual Data Story Construction from Tabular Data},author={Aodeng, Gerile and Li, Guozheng and Feng, Yunshan and Chen, Qiyang and Zhang, Yu and Liu, Chi Harold},booktitle={Proceedings of the 38th Annual ACM Symposium on User Interface Software and Technology},year={2025},publisher={Association for Computing Machinery},doi={10.1145/3746059.3747719},url={https://doi.org/10.1145/3746059.3747719},}
2024
TVCG
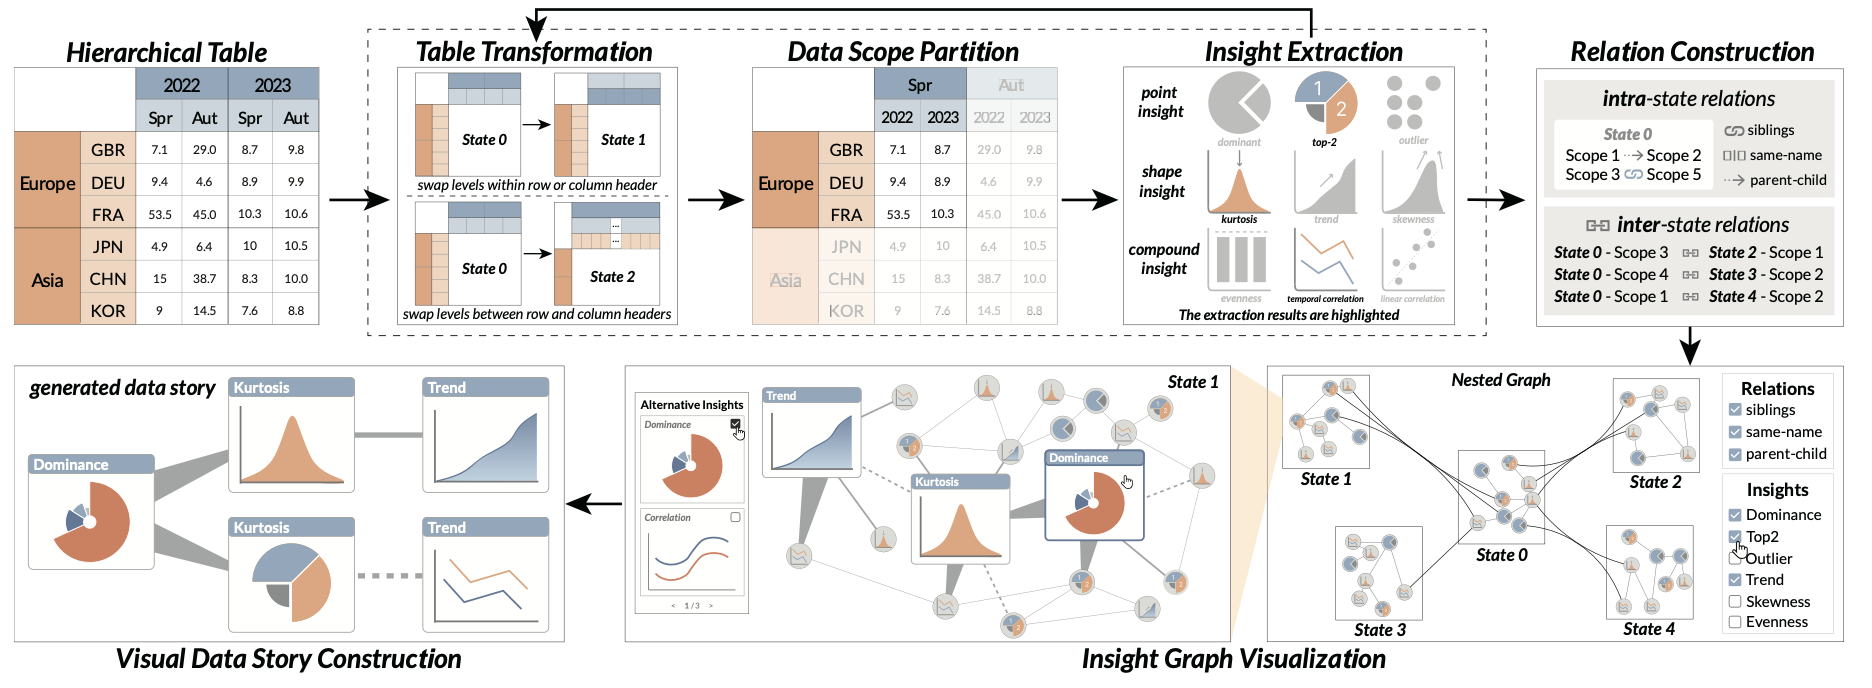
CoInsight: Visual Storytelling for Hierarchical Tables With Connected Insights
Guozheng Li, Runfei Li, Yunshan Feng, and 3 more authors
IEEE Transactions on Visualization and Computer Graphics, 2024
@article{li2024coinsight,title={CoInsight: Visual Storytelling for Hierarchical Tables With Connected Insights},author={Li, Guozheng and Li, Runfei and Feng, Yunshan and Zhang, Yu and Luo, Yuyu and Liu, Chi Harold},journal={IEEE Transactions on Visualization and Computer Graphics},volume={30},number={6},pages={3049--3061},year={2024},doi={10.1109/TVCG.2024.3388553},}